5 key takeaways from 2015 ETF flows
After taking in $238 billion in 2015, it's time for the annual reading of the fund flow tea leaves

It’s time for the annual reading of the exchange-traded fund flow tea leaves.
ETFs took in a grand total of about $238 billion in 2015 —just shy of their annual record of $243 billion set last year. No other investment vehicle came even close to this number. It is more than the flows into index funds, active mutual funds and hedge funds combined.
Here are five things from this year’s flows that we found most interesting.
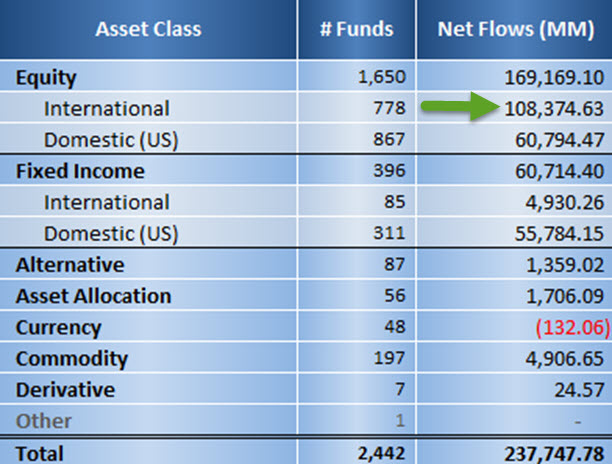
1. International ETFs took in nearly half of all flows
Like moths attracted to a porch light, ETF investors were drawn to accommodative central bank policies overseas as funds that invest outside the U.S. took in $108 billion—roughly double the inflows to ETFs that invest in U.S. stocks. Put another way, international ETFs accounted for 45% of all net flows even though they make make up only 20% of all ETF assets.
About half of that money played the “central bank trade” in currency-hedged ETFs while the rest of it went in unhedged. In the end, the hedged rout was a better choice, albeit not by much. The Deutsche X-trackers MSCI EAFE Hedged Equity ETF (DBEF), which took in $12.5 billion, was up 4% while the iShares MSCI EAFE ETF (EFA), which saw inflows of $9.3 billion, was flat for the year.
A big question for 2016 is where investors will go should quantitative easing go out of style across the globe.
2. SPY saw its most outflows ever as hot money went cold
The near-record breaking flow haul was especially impressive considering that the S&P 500 Trust (SPY) saw $32 billion in outflows—by far its worst year ever. This is the equivalent of the Cleveland Cavaliers making it to the NBA championship without LeBron James in the lineup. In fact, many of the super-liquid ETFs preferred by hot money investors also saw outflows including the iShares MSCI Emerging Markets ETF (EEM), the SPDR Gold Shares (GLD) and the iShares Russell 2000 ETF (IWM), as shown in the below table of the top 10 biggest outflows.

Hot money tends to dart in and out of these ETFs based on the way they are performing. In a pretty meh year for the U.S. stock market (and a horrendous one in emerging markets and commodities) these former ETF studs simply fell out of favor. That the ETF industry as a whole can attract billions of dollars of inflows when no asset class did all that well speaks to ETFs’ ability to continue siphoning away money away from mutual funds, single securities and derivatives as more investors switch over.
3. Low-cost and smart-beta ETFs picked up the slack
With those erstwhile ETF veterans out of the game, some new heroes stepped up, including the WisdomTree Europe Hedged Equity Fund (HEDJ) and the Deutsche X-trackers MSCI EAFE Hedged Equity ETF (DBEF) which took in $13.9 billion and $12.5 billion respectively. In addition, the Vanguard S&P 500 ETF (VOO)–both the youngest and cheapest of the S&P 500 Index ETFs–took in $13 billion as it continues to attract money rain or shine from buy-and-hold asset allocators.

These top flow-getters show that there are now two distinct and powerful evolutionary branches in the ETF market. One branch is battling “the fee war,” where it has brought down the cost of investing to the point where investors can now get diversified core exposure using ETFs for a blended fee of less than .10%. This is the side of the tracks ruled by Vanguard Group Inc. and Charles Schwab Corp., which drew in over $90 billion in new cash combined.
The other evolutionary branch is racing towards the robotization of active management. This side could also be dubbed “gadgets” as these are specially designed ETFs that give investors a chance to outperform the market, such as smart-beta ETFs which tilt or screen the holdings based on factors such as volatility, size or momentum. Smart-beta ETFs took in about $60 billion. Also included here are ETFs that package a trade, such as currency-hedged ETFs, which go long a set of international stocks and short the currency. They alone took in about $50 billion.
4. Leveraged ETFs grew twice as fast as ETFs as a whole
Speaking of gadgets, leveraged ETFs saw $6.3 billion of new money come in, or a 26% jump in assets from the beginning of the year compared with a 12% increase for ETFs as a whole. The reason for this outlier year in leveraged flows was the temptation to call a bottom in oil.
Investors spent about $20 billion in 2016 playing a rebound in oil—choosing leveraged products for a good chunk of that bet. In particular, the VelocityShares 3x Long Crude Oil ETN (UWTI) took in $2.4 billion, the highest amount of inflows a leveraged ETF has seen in six years. UWTI became a go-to for hot money looking to call a bottom in oil. Unfortunately for those “investors” it ended up losing 99% of its value on the year.

5. iShares upset Vanguard to take in the most cash
A few years ago it was pretty widely accepted that Vanguard would dominate ETF flows for years to come with their products that are at once, cheap, deep and increasingly liquid. But this year, BlackRock Inc.’s iShares–which makes both cheap ETFs and gadget ETFs–absolutely dominated the flow show, taking in $106 billion to Vanguard’s $76 billion. No one else was even close as seen in the chart below.

Boosting iShares inflows was the flood of money into international ETFs as they offer some of the most liquid international ETFs such as EFA and EZU. About a quarter of those flows came from their “core” product line, which was launched a couple of years ago–effectively pulling a Vanguard on Vanguard by lowering their fees to near-nothing. BlackRock is showing that you can fight battles — and win — on many fronts at once.
Learn more about reprints and licensing for this article.