
2022 marked a full year of rate hikes, unprecedented since the Global Financial Crisis, which propelled short-term yields upward and in turn ultimately caused the 10-2 spread1 to fall below zero in the second half of 2022, where it has since stayed. Recent market expectations suggest that the end of rate rises is perhaps in sight as we start to see its impact on a few U.S. regional banks as well as the forced takeover of one of Europe’s largest banks—Credit Suisse—earlier this year. While the latest U.S. inflation numbers have eased, employment data continues to suggest a strong labor market. It’s anyone’s guess whether the Fed will move rates in June.
Let us take a look at the performance of key USD indices in 2022, and 2023 YTD. Thereafter, we will explore how the index performance may have impacted ETFs flows in their respective categories so far this year.
1Source: Federal Reserve Bank of St. Louis
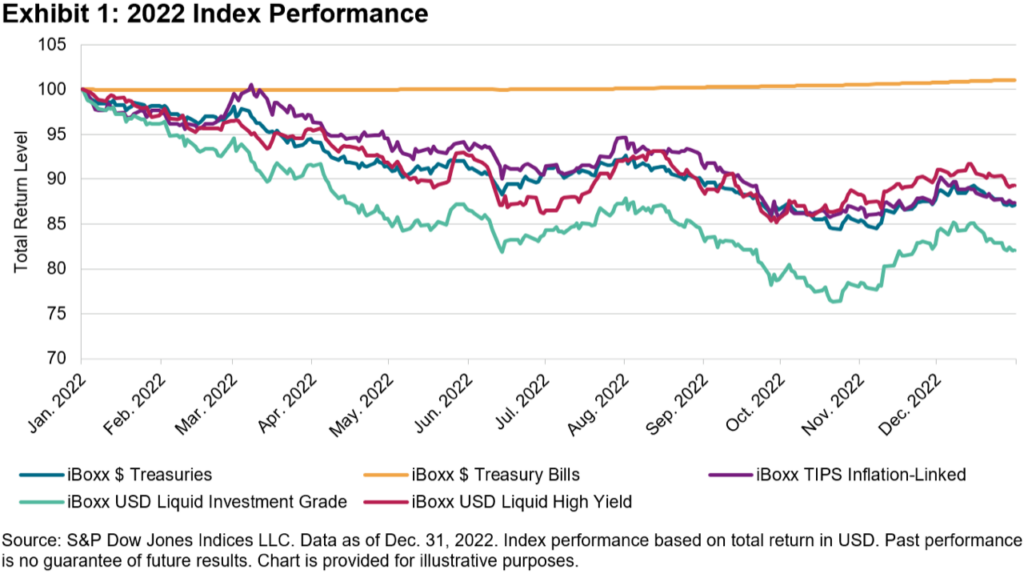
As can be seen in the chart above, 2022 was a pretty dismal year for USD fixed income, with the multiple rate hikes depressing the value of bonds, especially the longer tenors. The only index that was not adversely affected by the interest rate movements was the short-dated iBoxx $ Treasury Bills, which measures the performance of U.S. government bills with maturities of one year or less.
The worst-performing segment was high quality corporate bonds, as represented by the iBoxx USD Liquid Investment Grade. The index was down 17.9% in 2022.
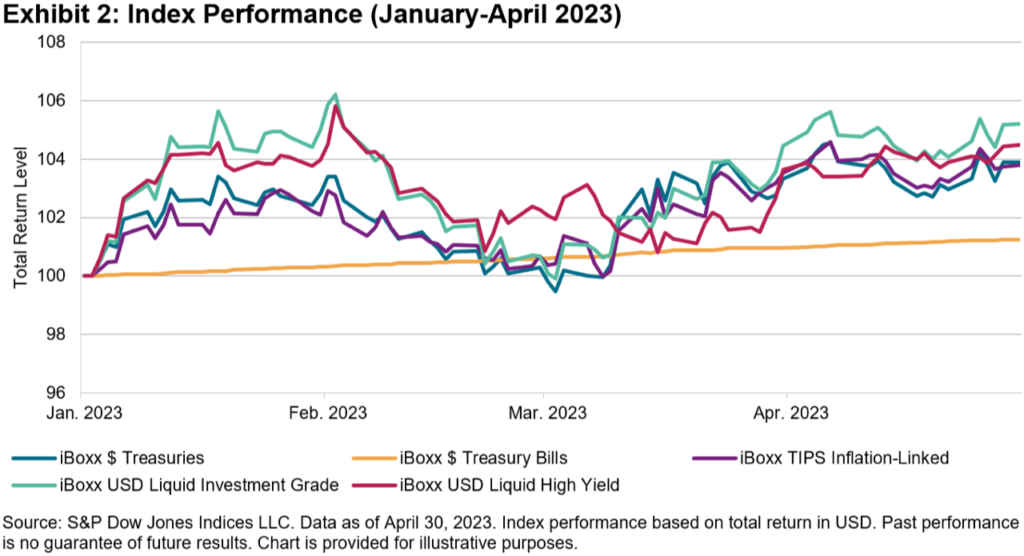
It has been a completely different story since the start of 2023; all of these featured indices are back in the black, led by the iBoxx USD Liquid Investment Grade with a YTD return of 5.2% (as of April 30, 2023), outperforming short-term treasury bills and other U.S. government securities.
The positive performance coincided with market sentiment that we may be nearing the end of the rate hikes, which may have prompted investors to start moving away from short-term bonds into longer-tenure bonds with an emphasis on credit quality.
As depicted in Exhibit 3, investors have seemingly begun to move away from inflation and money market products this year, with the majority of the flows moving into U.S. government bonds. Even though corporate investment grade bonds performed better than U.S. Treasuries (as seen in Exhibit 2), investors may still be cautious of the overall economic outlook and thus prefer the safe haven of a relatively risk-free asset over corporate investment grade bonds.
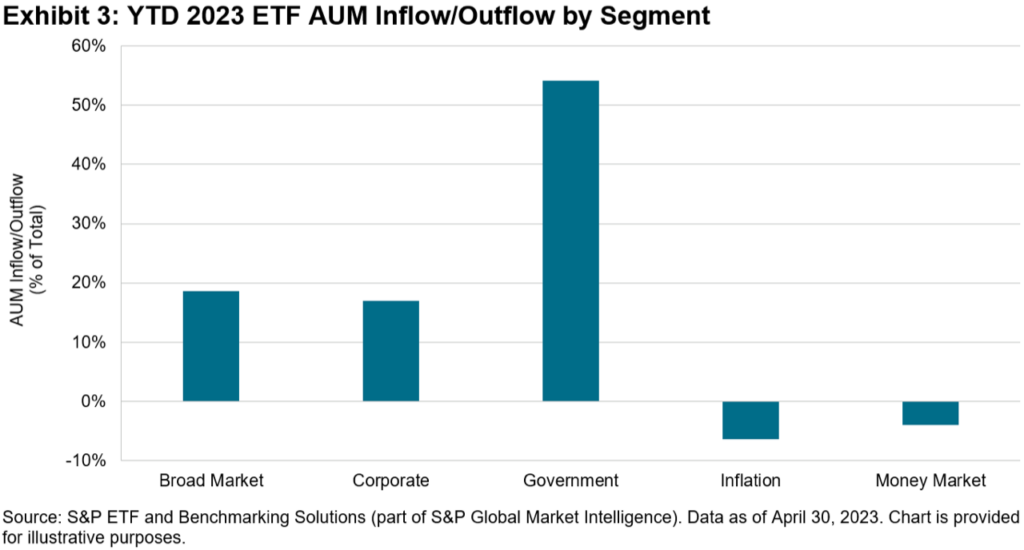
As of April 30, 2023, U.S. Treasuries—as represented by the iBoxx $ Treasuries—offered a yield of 3.73% with an annual modified duration of 6.35 years, while U.S. investment grade bonds—as represented by the iBoxx $ Liquid Investment Grade—offered a yield of 5.17% with an annual modified duration of 8.36 years.
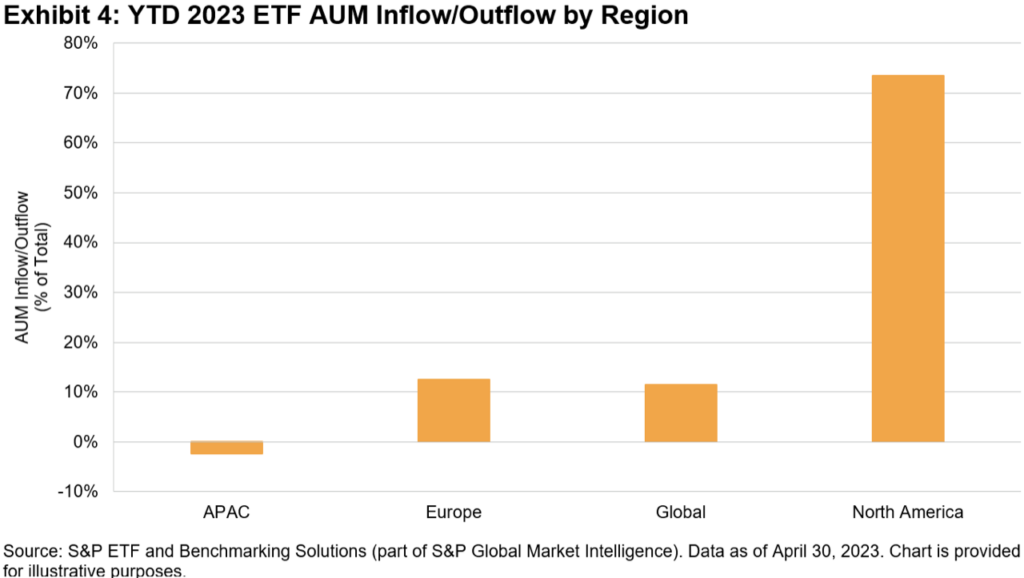
It is perhaps of no surprise that the majority of the AUM flows were directed into U.S. fixed income ETFs, given their dominance and market share in the overall ETF market. There has also been a small outflow from APAC ETFs so far this year, perhaps due to the preference for high quality bonds and higher yields in offshore markets compared to lower local currency yields in certain APAC markets.
In a hypothetical scenario, if one were to invest in a longer-term bond fund today and rates retreat over the next couple of years, the return on investment may be higher than the “offered yield” today due to capital appreciation of the bonds. This is due to the inverse relationship between bond prices and yields (as yields go down, bond prices go up).
As we may be approaching the end of the rate hikes, will we see a sustained shift toward medium-to-long dated bonds in the near future?
Read more at indexologyblog.com
This article was originally published at Indexology® Blog on May 24, 2023: https://www.indexologyblog.com/2023/05/24/a-quick-look-at-key-usd-indices-and-fixed-income-etf-flows-this-year/
General Disclaimer
© 2023 S&P Dow Jones Indices. All rights reserved. S&P, S&P 500, SPX, SPY, The 500, US500 , US 30, S&P 100, S&P COMPOSITE 1500, S&P 400, S&P MIDCAP 400, S&P 600, S&P SMALLCAP 600, S&P GIVI, GLOBAL TITANS, DIVIDEND ARISTOCRATS, Select Sector, S&P MAESTRO, S&P PRISM, S&P STRIDE, GICS, SPIVA, SPDR, INDEXOLOGY, iTraxx, iBoxx, ABX, ADBI, CDX, CMBX, MBX, MCDX, PRIMEX, HHPI and SOVX are trademarks of S&P Global, Inc. (“S&P Global”) or its affiliates. DOW JONES, DJIA, THE DOW and DOW JONES INDUSTRIAL AVERAGE are trademarks of Dow Jones Trademark Holdings LLC (“Dow Jones”). These trademarks together with others have been licensed to S&P Dow Jones Indices LLC. Redistribution or reproduction in whole or in part are prohibited without written permission of S&P Dow Jones Indices LLC. This document does not constitute an offer of services in jurisdictions where S&P Dow Jones Indices LLC, S&P Global, Dow Jones or their respective affiliates (collectively “S&P Dow Jones Indices”) do not have the necessary licenses. Except for certain custom index calculation services, all information provided by S&P Dow Jones Indices is impersonal and not tailored to the needs of any person, entity or group of persons. S&P Dow Jones Indices receives compensation in connection with licensing its indices to third parties and providing custom calculation services. Past performance of an index is not an indication or guarantee of future results.
It is not possible to invest directly in an index. Exposure to an asset class represented by an index may be available through investable instruments based on that index. S&P Dow Jones Indices does not sponsor, endorse, sell, promote or manage any investment fund or other investment vehicle that is offered by third parties and that seeks to provide an investment return based on the performance of any index. S&P Dow Jones Indices makes no assurance that investment products based on the index will accurately track index performance or provide positive investment returns. S&P Dow Jones Indices LLC is not an investment advisor, and S&P Dow Jones Indices makes no representation regarding the advisability of investing in any such investment fund or other investment vehicle. A decision to invest in any such investment fund or other investment vehicle should not be made in reliance on any of the statements set forth in this document. S&P Dow Jones Indices is not an investment adviser, commodity trading advisor, commodity pool operator, broker dealer, fiduciary, promoter” (as defined in the Investment Company Act of 1940, as amended), “expert” as enumerated within 15 U.S.C. § 77k(a) or tax advisor. Inclusion of a security, commodity, crypto currency or other asset within an index is not a recommendation by S&P Dow Jones Indices to buy, sell, or hold such security, commodity, crypto currency or other asset, nor is it considered to be investment advice or commodity trading advice.
These materials have been prepared solely for informational purposes based upon information generally available to the public and from sources believed to be reliable. No content contained in these materials (including index data, ratings, credit-related analyses and data, research, valuations, model, software or other application or output therefrom) or any part thereof (“Content”) may be modified, reverse-engineered, reproduced or distributed in any form or by any means, or stored in a database or retrieval system, without the prior written permission of S&P Dow Jones Indices. The Content shall not be used for any unlawful or unauthorized purposes. S&P Dow Jones Indices and its third-party data providers and licensors (collectively “S&P Dow Jones Indices Parties”) do not guarantee the accuracy, completeness, timeliness or availability of the Content. S&P Dow Jones Indices Parties are not responsible for any errors or omissions, regardless of the cause, for the results obtained from the use of the Content. THE CONTENT IS PROVIDED ON AN “AS IS” BASIS. S&P DOW JONES INDICES PARTIES DISCLAIM ANY AND ALL EXPRESS OR IMPLIED WARRANTIES, INCLUDING, BUT NOT LIMITED TO, ANY WARRANTIES OF MERCHANTABILITY OR FITNESS FOR A PARTICULAR PURPOSE OR USE, FREEDOM FROM BUGS, SOFTWARE ERRORS OR DEFECTS, THAT THE CONTENT’S FUNCTIONING WILL BE UNINTERRUPTED OR THAT THE CONTENT WILL OPERATE WITH ANY SOFTWARE OR HARDWARE CONFIGURATION. In no event shall S&P Dow Jones Indices Parties be liable to any party for any direct, indirect, incidental, exemplary, compensatory, punitive, special or consequential damages, costs, expenses, legal fees, or losses (including, without limitation, lost income or lost profits and opportunity costs) in connection with any use of the Content even if advised of the possibility of such damages.
S&P Global keeps certain activities of its various divisions and business units separate from each other in order to preserve the independence and objectivity of their respective activities. As a result, certain divisions and business units of S&P Global may have information that is not available to other business units. S&P Global has established policies and procedures to maintain the confidentiality of certain non-public information received in connection with each analytical process.
In addition, S&P Dow Jones Indices provides a wide range of services to, or relating to, many organizations, including issuers of securities, investment advisers, broker-dealers, investment banks, other financial institutions and financial intermediaries, and accordingly may receive fees or other economic benefits from those organizations, including organizations whose securities or services they may recommend, rate, include in model portfolios, evaluate or otherwise address.

RBC Wealth Management's latest move in New York adds an elite eight-member team to its recently opened Westchester office.

Stifel – so far - is on the hook for more than $166 million in damages, legal fees and settlements in investor complaints involving Roberts, a 35-year industry veteran.

The giant alt investments platform's latest financing led by T. Rowe Price and SurgoCap Partners, along with State Street, UBS, and BNY, will fuel additional growth on multiple fronts.

Some investors recently have seen million dollar plus decisions by FINRA arbitration panels involving complex products decisions go their way.

New report shines a light on how Americans view wealth today.
Orion's Tom Wilson on delivering coordinated, high-touch service in a world where returns alone no longer set you apart.
Barely a decade old, registered index-linked annuities have quickly surged in popularity, thanks to their unique blend of protection and growth potential—an appealing option for investors looking to chart a steadier course through today's choppy market waters, says Myles Lambert, Brighthouse Financial.

