
The outperformance of equal weight indices is well documented, especially for the S&P 500® Equal Weight Index’s 20 years of live history. Equal Weight’s relative returns reflect the impact of several important index characteristics. For example, smaller-size exposure and (anti-) momentum effects together account for around 75% of the historical variation of its relative returns.
Elevated sector dispersion has made sector allocations more important in explaining Equal Weight’s recent relative returns. Indeed, the S&P 500 Equal Weight Index’s greater exposure to Energy and lower exposure to Communication Services, Information Technology and Consumer Discretionary accounted for around two-thirds of its 7% outperformance in 2022. These exposures also helped to explain the index’s underperformance in Q1 2023.
At the same time, it’s important not to overlook the impact of equal weighting within each sector. To see why, we construct hypothetical “intermediate” portfolios that represent steps along distinct paths between the S&P 500 and the S&P 500 Equal Weight Index. Exhibit 1 summarizes these two hypothetical paths.
The hypothetical “Sectors Matching EQW” portfolio adjusts S&P 500 sector weights so that they match those of the Equal Weight Index while ensuring that companies within the same sector remain float market-cap weighted. Alternatively, the hypothetical “EQW Within Sectors” portfolio retains the S&P 500’s sector allocations but weights every name equally within each sector.
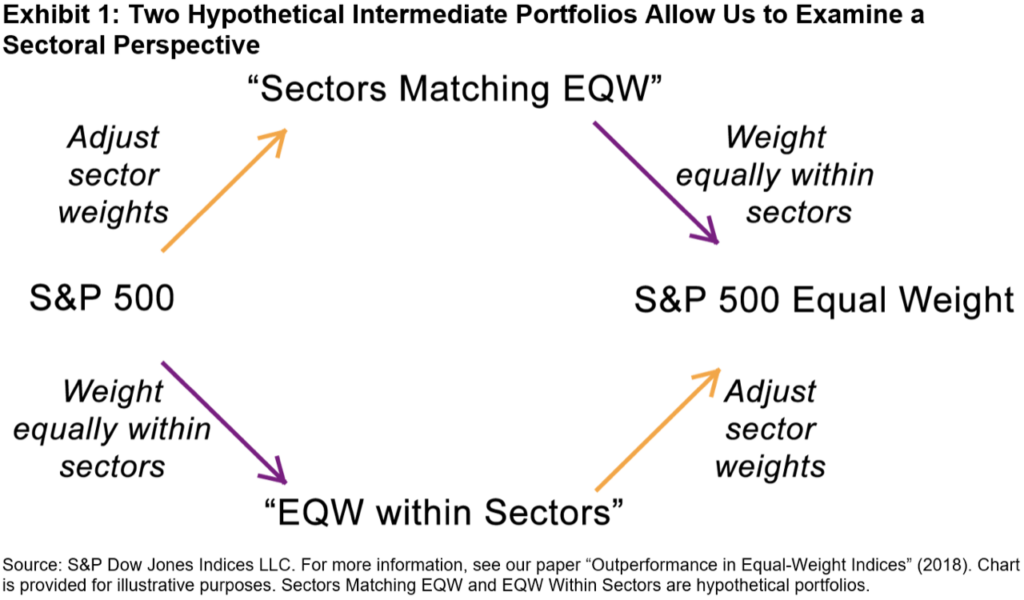
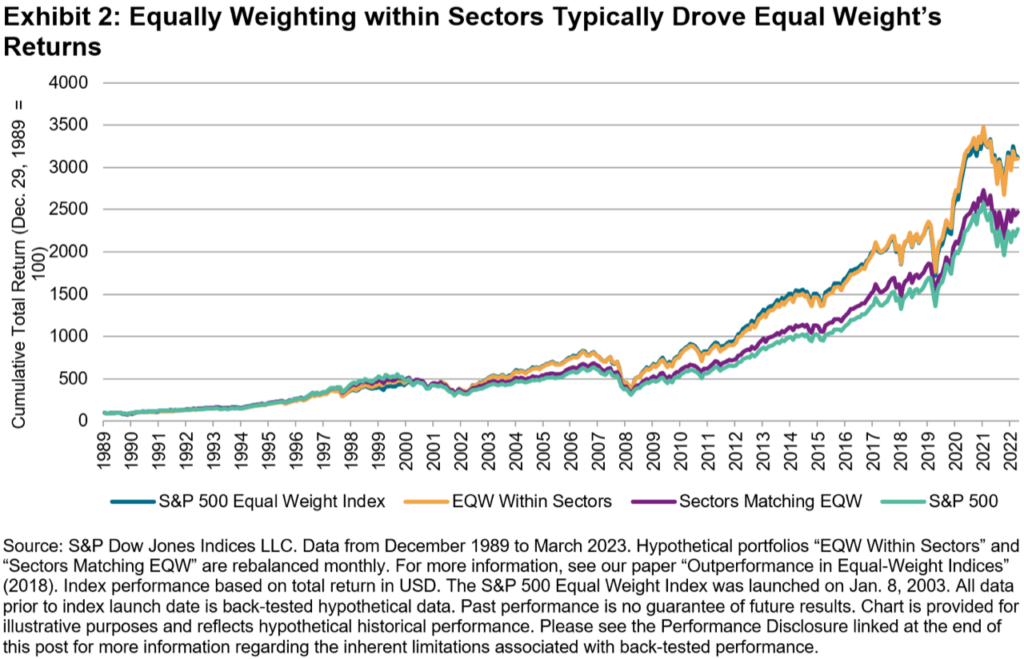
Exhibit 2 shows that equally weighting within each sector mattered more when explaining the S&P 500 Equal Weight Index’s historical returns. Indeed, the cumulative total return for the hypothetical “EQW Within Sectors” portfolio is graphically indistinguishable from that of the S&P 500 Equal Weight Index. While the equal weight index may have sporadically benefited from its distinct sector allocations, having more exposure to the smaller names within each sector was the most important driver of the S&P 500 Equal Weight Index’s returns.
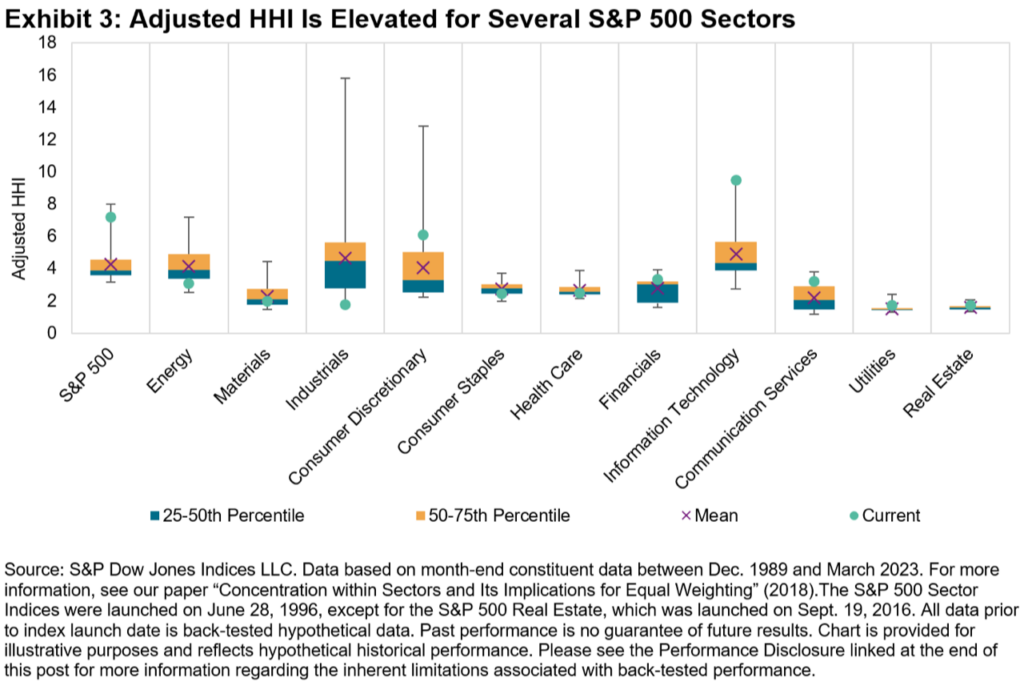
The relative degree of concentration within sectors suggests a potential tactical application. Exhibit 3 shows the distribution of adjusted Herfindahl-Hirschman Index (HHI) figures for the S&P 500 and its 11 GICS sectors; a higher adjusted HHI figure means that concentration is higher, independent of the number of stocks in each index. The current concentration is elevated in several sectors, particularly in Information Technology.
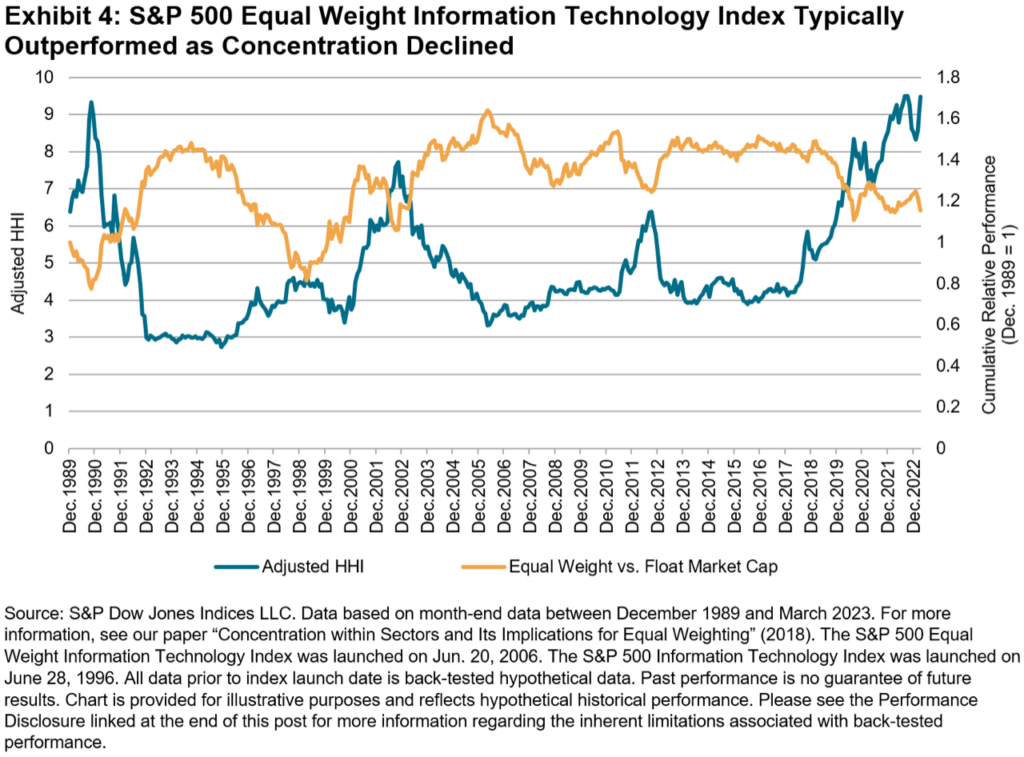
By definition, equally weighted sector indices have less exposure to larger names than do their float market-cap counterparts. All else equal, falling concentration indicates underperformance from the largest names, and vice-versa. Hence, one would expect equally weighted sectors to outperform when concentration falls.
Exhibit 4 confirms this expectation: the S&P 500 Equal Weight Information Technology Index typically outperformed its float market-cap counterpart when the sector’s adjusted HHI declined. Hence, to the extent that current concentration levels decline, market participants may wish to consider the potential applications of an equally weighted sector strategy.
For more information on the interaction between concentration and equal weight performance, and to celebrate the S&P 500 Equal Weight Index’s 20th birthday, check out the replay of our Index Strategy Update from April 20, 2023.
Read more at indexologyblog.com
This article was originally published at Indexology® Blog on April 26, 2023 https://www.indexologyblog.com/2023/04/26/equally-weighting-within-sectors-impact-and-potential-applications/
General Disclaimer
© 2023 S&P Dow Jones Indices. All rights reserved. S&P, S&P 500, S&P 500 LOW VOLATILITY INDEX, S&P 100, S&P COMPOSITE 1500, S&P 400, S&P MIDCAP 400, S&P 600, S&P SMALLCAP 600, S&P GIVI, GLOBAL TITANS, DIVIDEND ARISTOCRATS, S&P TARGET DATE INDICES, S&P PRISM, S&P STRIDE, GICS, SPIVA, SPDR and INDEXOLOGY are registered trademarks of S&P Global, Inc. (“S&P Global”) or its affiliates. DOW JONES, DJ, DJIA, THE DOW and DOW JONES INDUSTRIAL AVERAGE are registered trademarks of Dow Jones Trademark Holdings LLC (“Dow Jones”). These trademarks together with others have been licensed to S&P Dow Jones Indices LLC. Redistribution or reproduction in whole or in part are prohibited without written permission of S&P Dow Jones Indices LLC. This document does not constitute an offer of services in jurisdictions where S&P Dow Jones Indices LLC, S&P Global, Dow Jones or their respective affiliates (collectively “S&P Dow Jones Indices”) do not have the necessary licenses. Except for certain custom index calculation services, all information provided by S&P Dow Jones Indices is impersonal and not tailored to the needs of any person, entity or group of persons. S&P Dow Jones Indices receives compensation in connection with licensing its indices to third parties and providing custom calculation services. Past performance of an index is not an indication or guarantee of future results.
It is not possible to invest directly in an index. Exposure to an asset class represented by an index may be available through investable instruments based on that index. S&P Dow Jones Indices does not sponsor, endorse, sell, promote or manage any investment fund or other investment vehicle that is offered by third parties and that seeks to provide an investment return based on the performance of any index. S&P Dow Jones Indices makes no assurance that investment products based on the index will accurately track index performance or provide positive investment returns. S&P Dow Jones Indices LLC is not an investment advisor, and S&P Dow Jones Indices makes no representation regarding the advisability of investing in any such investment fund or other investment vehicle. A decision to invest in any such investment fund or other investment vehicle should not be made in reliance on any of the statements set forth in this document. Prospective investors are advised to make an investment in any such fund or other vehicle only after carefully considering the risks associated with investing in such funds, as detailed in an offering memorandum or similar document that is prepared by or on behalf of the issuer of the investment fund or other investment product or vehicle. S&P Dow Jones Indices LLC is not a tax advisor. A tax advisor should be consulted to evaluate the impact of any tax-exempt securities on portfolios and the tax consequences of making any particular investment decision. Inclusion of a security within an index is not a recommendation by S&P Dow Jones Indices to buy, sell, or hold such security, nor is it considered to be investment advice. Closing prices for S&P Dow Jones Indices’ US benchmark indices are calculated by S&P Dow Jones Indices based on the closing price of the individual constituents of the index as set by their primary exchange. Closing prices are received by S&P Dow Jones Indices from one of its third party vendors and verified by comparing them with prices from an alternative vendor. The vendors receive the closing price from the primary exchanges. Real-time intraday prices are calculated similarly without a second verification.
These materials have been prepared solely for informational purposes based upon information generally available to the public and from sources believed to be reliable. No content contained in these materials (including index data, ratings, credit-related analyses and data, research, valuations, model, software or other application or output therefrom) or any part thereof (“Content”) may be modified, reverse-engineered, reproduced or distributed in any form or by any means, or stored in a database or retrieval system, without the prior written permission of S&P Dow Jones Indices. The Content shall not be used for any unlawful or unauthorized purposes. S&P Dow Jones Indices and its third-party data providers and licensors (collectively “S&P Dow Jones Indices Parties”) do not guarantee the accuracy, completeness, timeliness or availability of the Content. S&P Dow Jones Indices Parties are not responsible for any errors or omissions, regardless of the cause, for the results obtained from the use of the Content. THE CONTENT IS PROVIDED ON AN “AS IS” BASIS. S&P DOW JONES INDICES PARTIES DISCLAIM ANY AND ALL EXPRESS OR IMPLIED WARRANTIES, INCLUDING, BUT NOT LIMITED TO, ANY WARRANTIES OF MERCHANTABILITY OR FITNESS FOR A PARTICULAR PURPOSE OR USE, FREEDOM FROM BUGS, SOFTWARE ERRORS OR DEFECTS, THAT THE CONTENT’S FUNCTIONING WILL BE UNINTERRUPTED OR THAT THE CONTENT WILL OPERATE WITH ANY SOFTWARE OR HARDWARE CONFIGURATION. In no event shall S&P Dow Jones Indices Parties be liable to any party for any direct, indirect, incidental, exemplary, compensatory, punitive, special or consequential damages, costs, expenses, legal fees, or losses (including, without limitation, lost income or lost profits and opportunity costs) in connection with any use of the Content even if advised of the possibility of such damages.
S&P Global keeps certain activities of its various divisions and business units separate from each other in order to preserve the independence and objectivity of their respective activities. As a result, certain divisions and business units of S&P Global may have information that is not available to other business units. S&P Global has established policies and procedures to maintain the confidentiality of certain non-public information received in connection with each analytical process.
In addition, S&P Dow Jones Indices provides a wide range of services to, or relating to, many organizations, including issuers of securities, investment advisers, broker-dealers, investment banks, other financial institutions and financial intermediaries, and accordingly may receive fees or other economic benefits from those organizations, including organizations whose securities or services they may recommend, rate, include in model portfolios, evaluate or otherwise address.

AI is no replacement for trusted financial advisors, but it can meaningfully enhance their capabilities as well as the systems they rely on.

Prudential's Jordan Toma is no "Finfluencer," but he is a registered financial advisor with four million social media followers and a message of overcoming personal struggles that's reached kids in 150 school across the US.

GReminders is deepening its integration partnership with a national wealth firm, while Advisor CRM touts a free new meeting tool for RIAs.

The Texas-based former advisor reportedly bilked clients out of millions of dollars, keeping them in the dark with doctored statements and a fake email domain.

The $3.3 trillion tax and spending cut package narrowly got through the upper house, with JD Vance casting the deciding vote to overrule three GOP holdouts.
Orion's Tom Wilson on delivering coordinated, high-touch service in a world where returns alone no longer set you apart.
Barely a decade old, registered index-linked annuities have quickly surged in popularity, thanks to their unique blend of protection and growth potential—an appealing option for investors looking to chart a steadier course through today's choppy market waters, says Myles Lambert, Brighthouse Financial.

