Financial advisers looking to add alpha to low-cost indexed investing could find some success by simply diversifying beyond traditional market-cap-weighted benchmarks, which typically concentrate exposure to a small group of the largest companies.
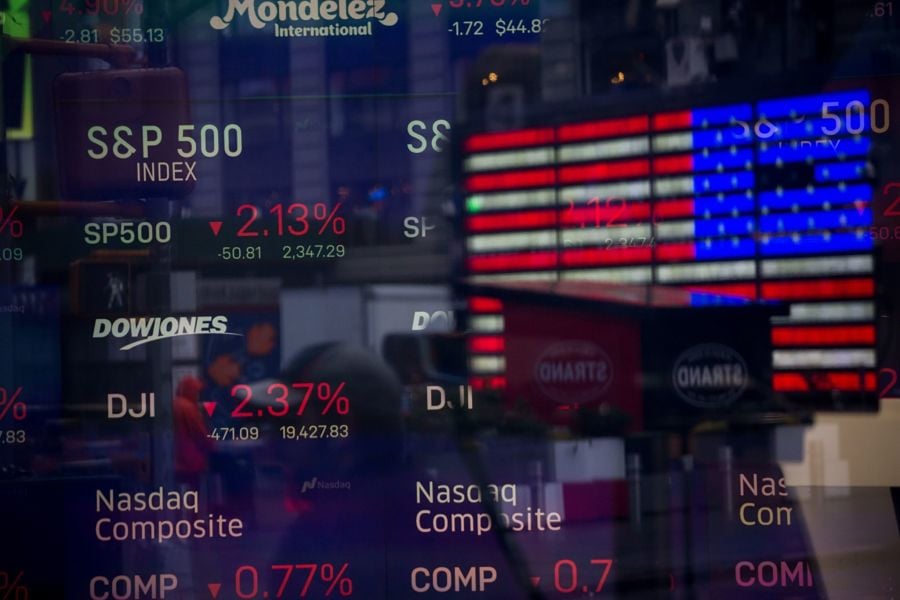
The S&P 500 Index represents the classic example of the illusion of diversification when it comes to indexed-based investing.
While investors and maybe even some financial advisers might believe they’re getting broad exposure though an index allocated to more than 500 stocks, the reality is that the top five holdings in the traditional S&P 500 combine for the same weight in the index as the bottom 370 companies.
The basic model of an index constructed based on the market capitalization of the underlying companies means investors end up most heavily exposed to the few companies at the top.
There’s nothing wrong with that as long as investors understand the risk-reward scenarios. For instance, if you combine communication and information, the technology sector makes up about 40% of the S&P 500, and most analysts view the sector as a lead driver of the index's volatility.
By contrast, an equally weighted version of the S&P 500 would have about a 19% exposure to tech stocks.
Equal weighting is just one of the alternatives to market-cap weighting. The Dow Jones Industrial Average, for example, is a price-weighted index.
In terms of an easy diversifier away from the top-heavy cap-weighted indexes, equal weighting has potential.
“Many investors have been told you want to buy low and sell high, but with a market-cap weighted index approach this does not occur,” said Todd Rosenbluth, director of mutual fund and ETF research at CFRA.
“Indeed, mega-cap companies like Apple and Amazon have swelled in size over the years,” Rosenbluth said. “An equally weighted approach rebalanced quarterly does the work for the investor, taking profits from the winners and adding exposure to the laggards in a risk-controlled manner.”
The only three funds offering equally weighted exposure to the S&P 500 have nearly doubled the performance of their cap-weighted counterparts since the start of the year, suggesting a potential inflection point.
The $7.1 billion Invesco Equally Weighted S&P 500 Fund (VADDX), the $24.3 billion Invesco S&P 500 Equal Weight ETF (RSP), and the $70 million Index Fund S&P 500 Equal Weight Fund (INDEX) are all up about 11.9% from the start of the year.
Meanwhile the popular cap-weighted versions of the benchmark, the $340 billion SPDR S&P 500 ETF (SPY) and the $203 billion Vanguard S&P 500 ETF (VOO), are both up 6% this year.
While the equally weighted versions have only been around for 18 years, back-tested performance going back 70 years favors equally weighted models by about 200 basis points annually, according to an analysis by Seeking Alpha.
That two percentage points per year adds up.
The Seeking Alpha report showed that $1 invested in a market-cap weighted version of the S&P 500 in 1926 would have grown to $8,096 by the end of 2017. That same dollar invested in an equally weighted version of the index in 1926 would have grown to $24,449 at the end of 2017.
Mike Willis, founder and lead portfolio manager of Index Funds, represents a newcomer to the equal-weight camp with a fund he launched in 2015.
Like most fans of equally weighted index exposure, Willis isn’t arguing for one over the other, but is making the case that equally weighted indexes can be paired with cap-weighted versions to essentially beat the market with simple indexes.
Since the first equally weighted versions of the S&P 500 were launched in 2003, the strategy has moved in cycles, swapping the lead eight times with their cap-weighted counterpart.
From 2003 through 2006, the equally weighed indexes beat cap-weighted, which followed a two-year win streak by cap-weighted during the market downturn in 2007 and 2008. Equal-weight bounced back during the market rebound in 2009 and 2010, cap-weighted took the lead in 2011, then equal-weight went on another three-year win streak.
In 2015, the performance lead to cap-weighted, then back to equal-weight in 2016, and cap-weighted won the past four years.
The leadership changes between the two versions of the same index can be explained by some of the extreme differences when it comes to sector weightings.
Beyond the most extreme example of technology companies mentioned above, industrials make up 14.1% of the equal-weight index and just 8.4% of the cap-weighted version.
Real estate has a 6% weighting in the equal-weight index, but represents the lowest sector in the cap-weighted index, at 2.4%. Consumer staples is around 6% in both indexes, making it the only sector without an extreme difference in weighting.

Broker-dealers that sold the defunct securities backed by Inspired Healthcare generated more than $100 million in fees and commissions.

FINRA barred the advisor, Sung Moo Cho, last month.

A new MetLife survey finds real estate professionals are increasingly steering clients toward tax experts as rising property values leave more sellers facing significant capital gains.

The independent broker-dealer expands its business development bench with a new recruiter and an internal promotion in the West.

The leading ultra-high-net-worth RIA joins other large wealth firms, including Raymond James and LPL, in creating executive roles focused on artificial intelligence strategy
Dan Biagini of American Equity says the steady decline of pensions, longer lifespans and a reset in interest rates are rewriting how advisors build retirement income
Direct indexing is on pace to outgrow ETFs and mutual funds. Northern Trust's Ken Lassner explains why the advisors who get it wish they had started sooner.

